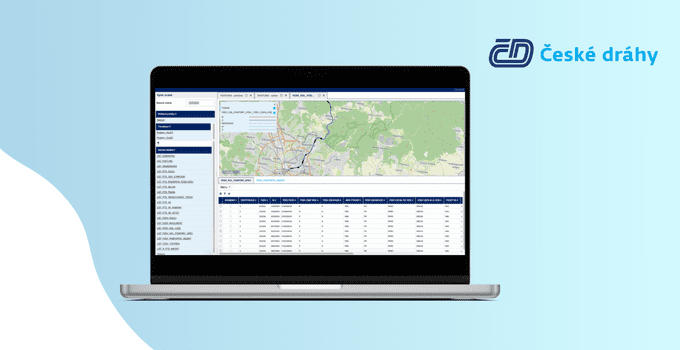
Data visualisation system for Czech Railways
Czech Railways is the dominant carrier of passenger train transport in the Czech Republic. We have created a Portal for collecting, managing and displaying large-volume data on a map.
Implementation
We have created a specific web application that can dynamically render HTML components based on page state passed from the back-end via a REST API. These components communicate with each other to send changes and receive their updated state.
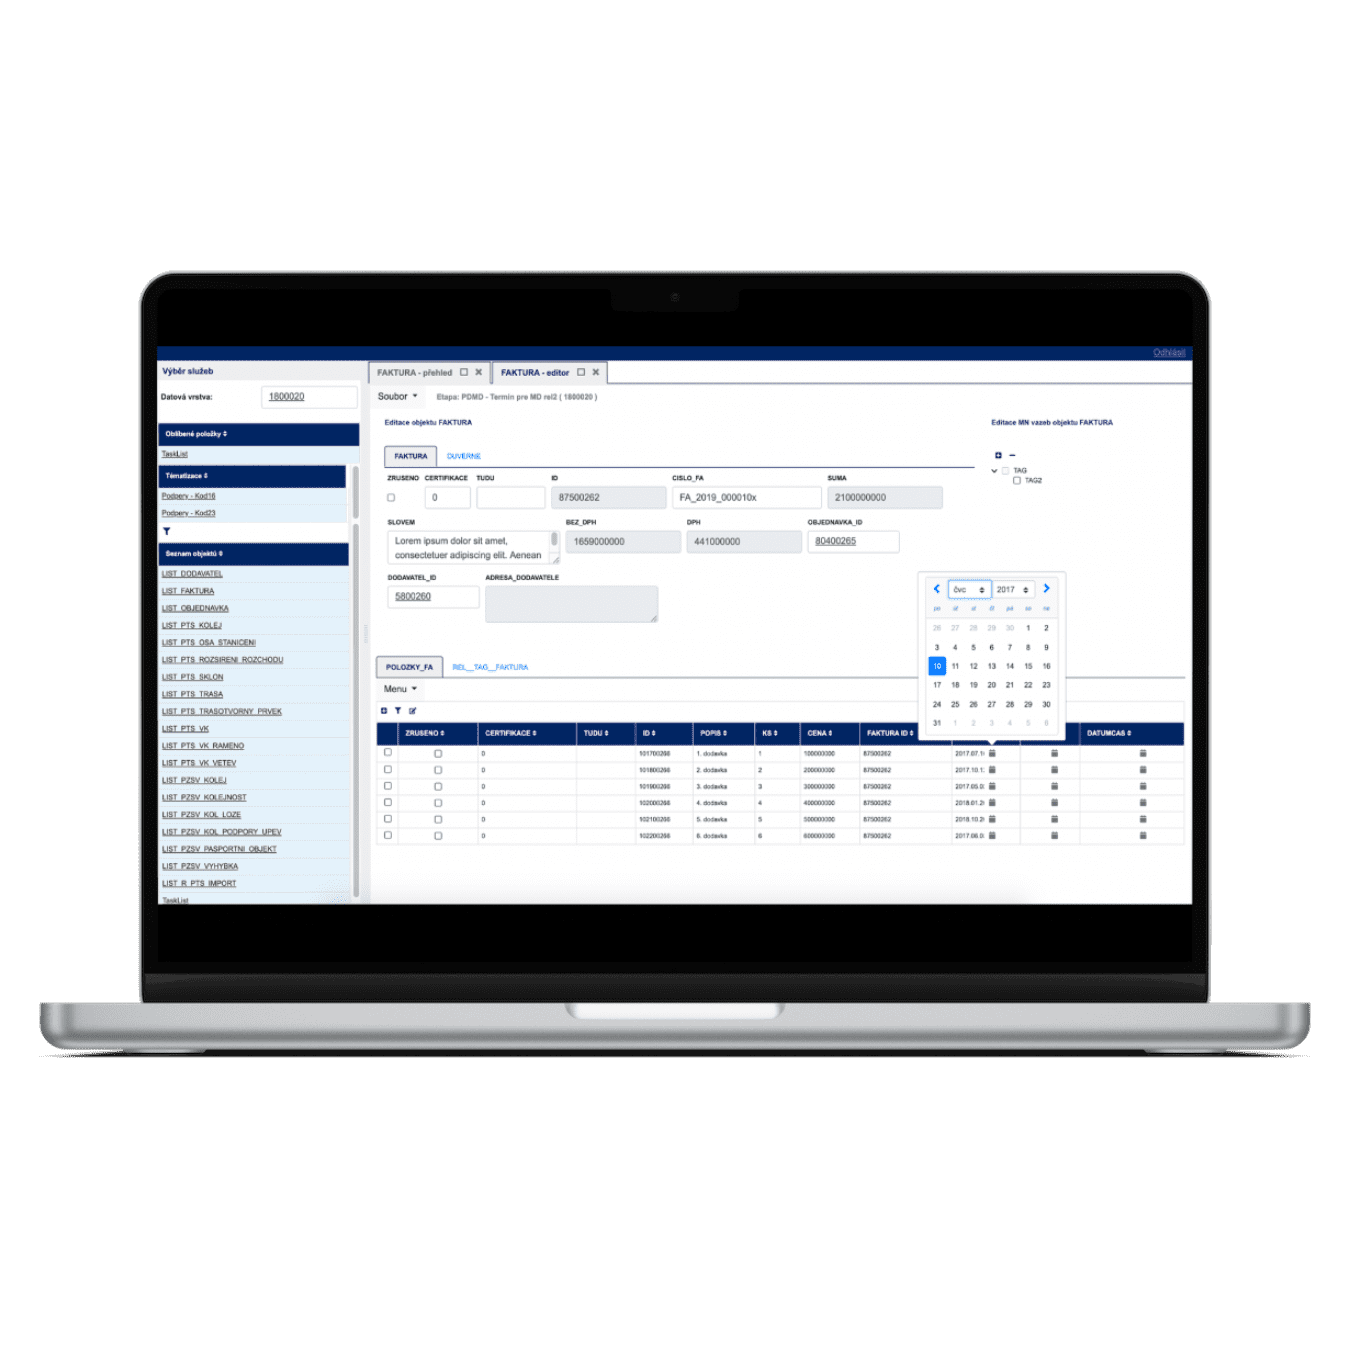
These are standard user interface components such as windows, layouts, tables, comboboxes, input fields, labels, menus, tabs.
Year 2019. Technologies used:Angular
Services provided
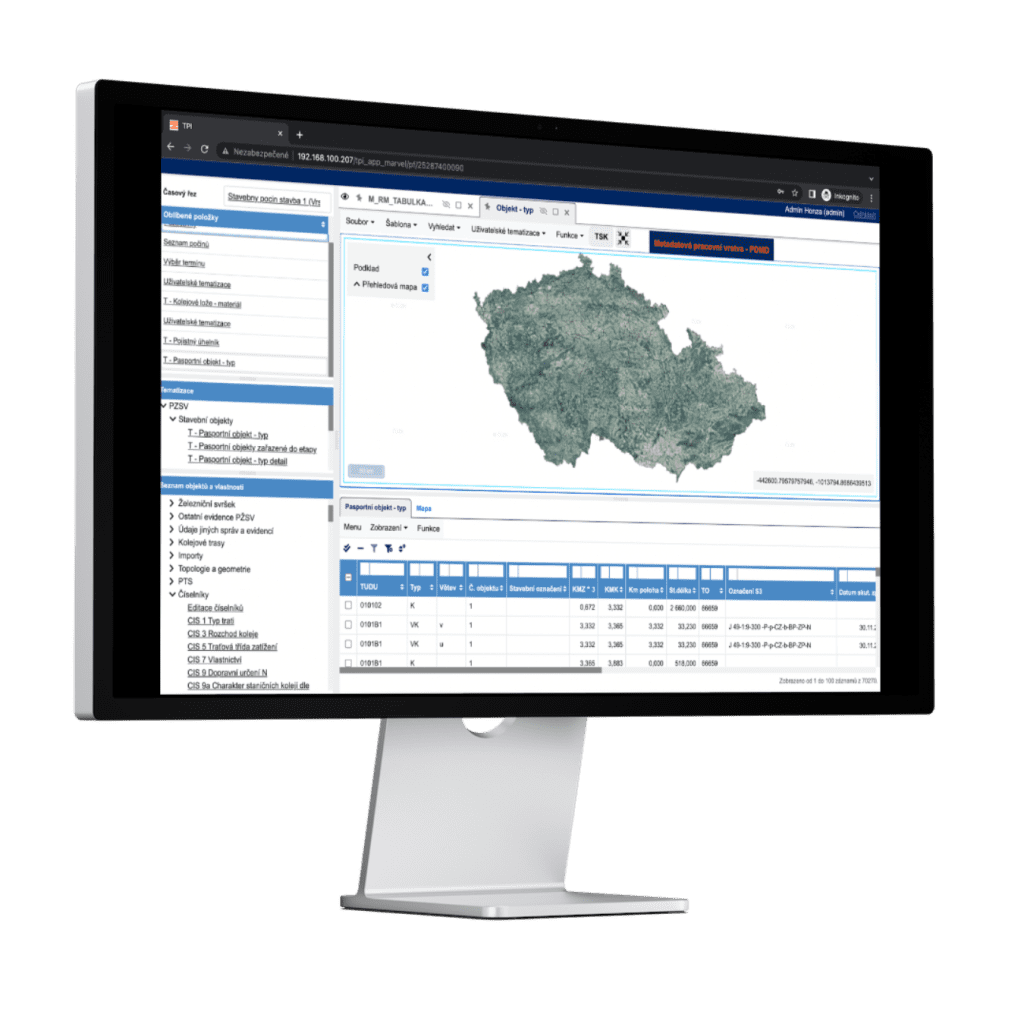
- Visualization of large-volume data
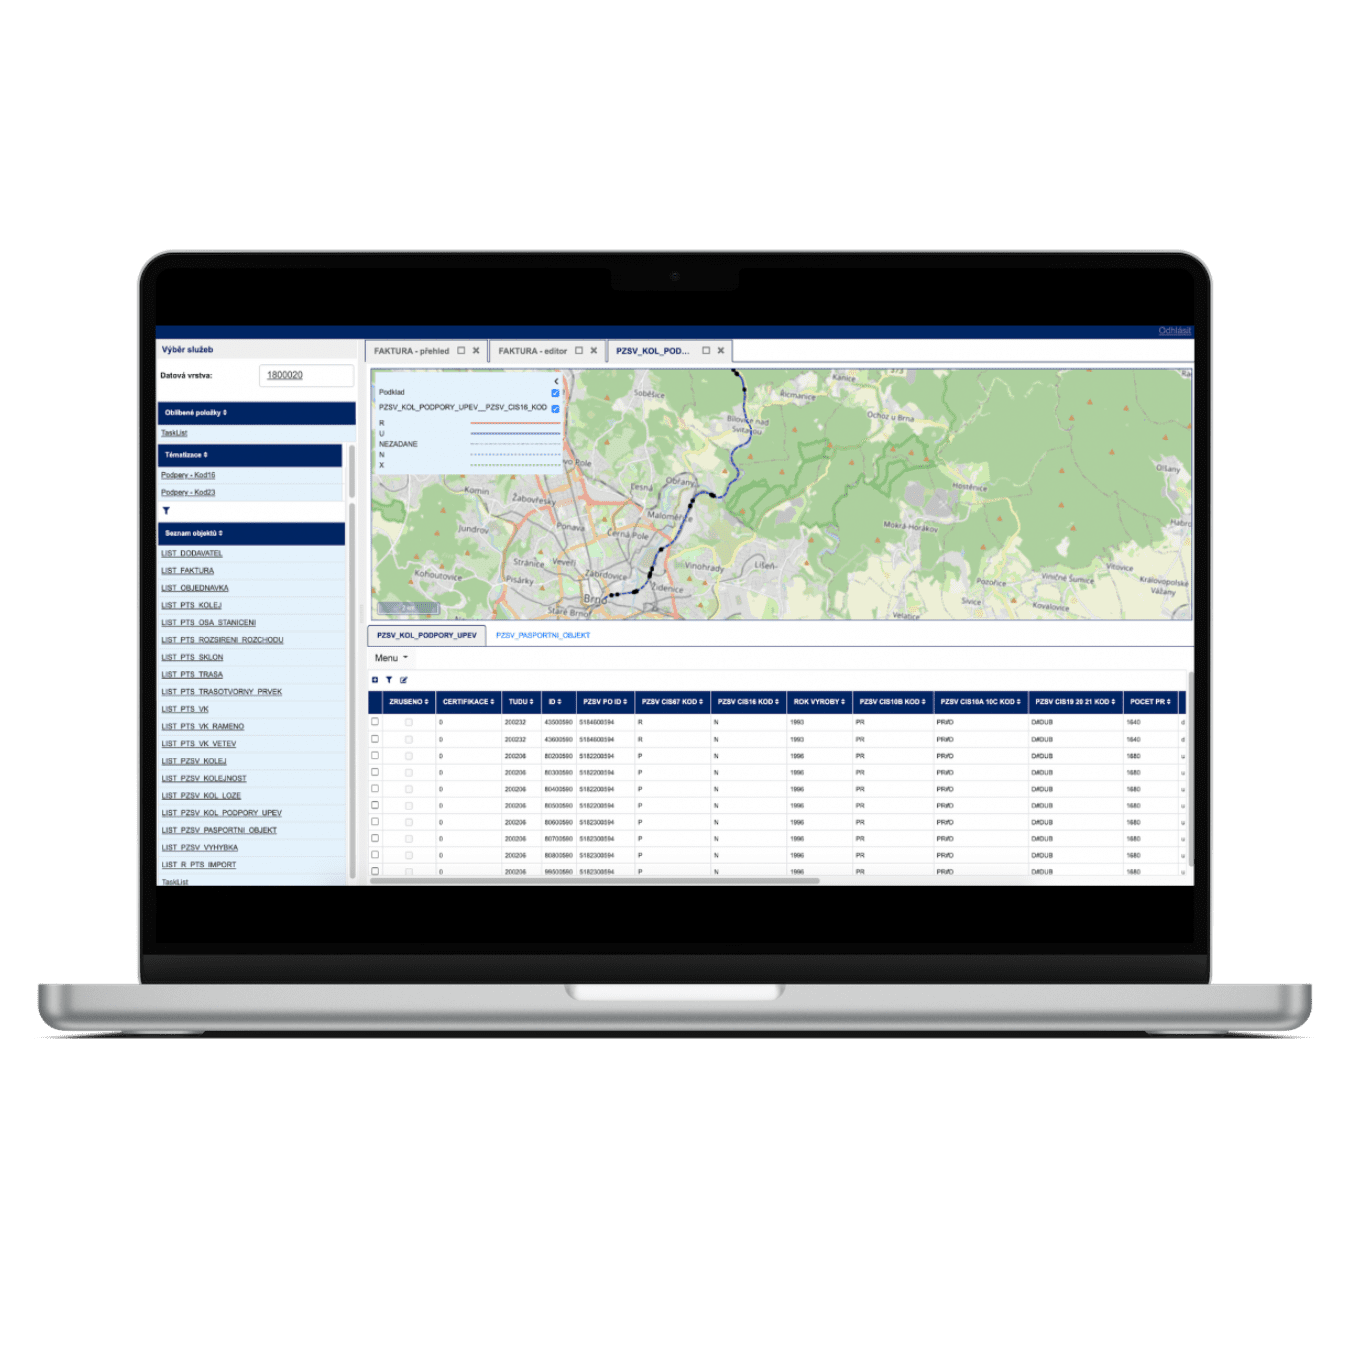
- Data collection, management and display - routes, switches, tracks and faults on the map portal
- Use of map data and satellite images supplied by Czech Railways
- Structured search and object filtering
- Dynamic filters, statistics, and data views
Result
Creating a frontend web application that can display the entire user interface based on metadata received from the server. The metadata contains the entire UI structure, including styling, data, and available events (events) that the client application uses to communicate back to the server. A solution is required to improve the management of internal processes using metadata-driven client applications, the customisation of which will be in the hands of the client.
Streamlining and speeding up the facilities management process for ČD employees. Improving data accessibility. Simplification of work with data. Reduction of error rate of internal processes